Slope
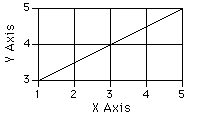
The slope of a line is the steepness of the line. It is measured as the change in Y associated with a change of one unit on X. The following graph shows a line with a slope of 0.5.

A change of 1 on the X axis is associated with a change of 0.5 on the Y axis. For example, as X changes from 2 to 3, Y changes from 3.5 to 4. Lines with positive slopes go from the bottom left toward the upper right. Lines with negative slopes go from the upper right to the lower left.
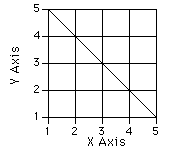
The following graph has a slope of -1: An increase of 1 on the X axis is associated with a decrease of 1 on the Y Axis.
